Modern UI Color Palettes for Data Visualization Design
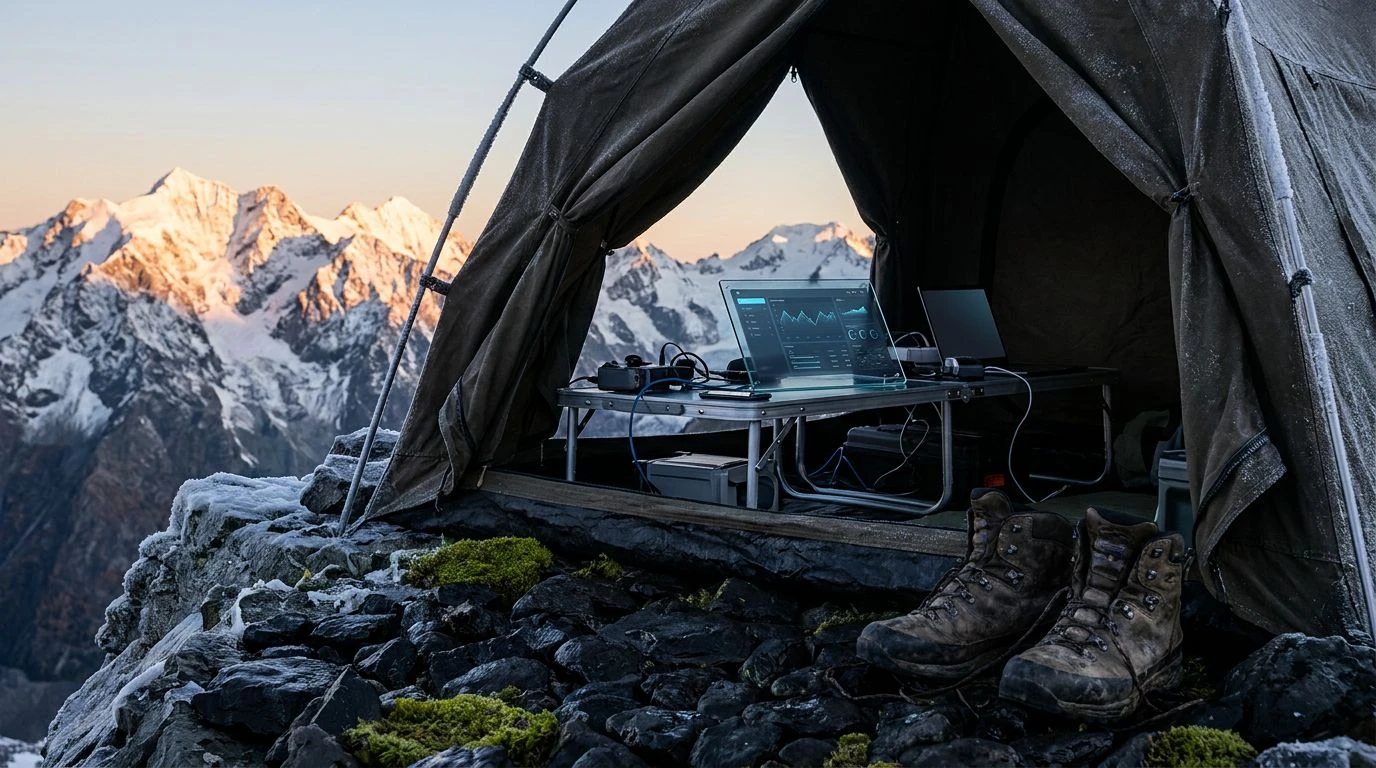
· 5 min readWhen staring down a spreadsheet overflowing with thousands of misaligned rows, the brain craves a visual reset. Translating the stark, unforgiving environment of a Himalayan basecamp into UI design offers a drastic and effective solution to screen fatigue. The severe contrast found at high altitudes where jagged rock meets a shockingly clear sky strips away the unnecessary and forces a brutal focus. Applying this aesthetic to data-heavy tasks means swapping out polite, indecisive pastels for a mercilessly crisp visual hierarchy. By leaning on the freezing shock of cerulean blue against the unyielding neutrality of slate grey, we create a digital workspace that feels less like a chaotic filing cabinet and more like a carefully mapped expedition route. It is about creating breathing room in claustrophobic datasets, using color not as decoration, but as an oxygen tank for the overworked eye.
Basecamp Sunrise ⛺
Basecamp Sunrise ⛺ captures the exact moment the morning sun hits the frost on a mountain ridge, providing a visual system that thrives on strict prioritization. Altitude Azure acts as the primary focal point, cutting through the dense layout of a massive financial model like freezing wind, directing attention exactly where it needs to go. Sherpa Leather and Glacial Dust establish a rugged, dependable background structure, allowing gridlines and text blocks to rest without exhausting the retina. Fogged Carabiner introduces a muted metallic utility, separating secondary data points from primary actionable tasks. To highlight critical errors or urgent cells, Summit Amber flashes with the urgency of a high-altitude warning beacon. This combination guarantees that the most crucial information remains visible, ensuring the user experiences total mental relief even when navigating the densest, most demanding rows of information.
Oxygen Deprivation 🏔️
Oxygen Deprivation 🏔️ builds a high-contrast environment designed to force absolute focus during marathon data-entry sessions. The aggressive grounding of Obsidian Crevasse swallows up distracting UI elements, leaving only the essential data visible. Deep Cerulean provides a sharp, clinical accent for active rows and selected cells, delivering that harsh clarity required when validating complex formulas. Weathered Khaki functions as an earthy, stabilizing neutral for row banding, reducing the blinding glare of a standard white spreadsheet. Signal Flare steps in as the ultimate high-visibility marker, pulling the eye immediately toward missing values or broken links, much like a distress flag against a rocky cliff. Windburned Skin softens the edges of secondary interfaces, offering just enough warmth to prevent the overall interface from becoming too sterile. The resulting visual system turns a chaotic workbook into a streamlined, highly functional survival kit.
Ice Axe Precision ⛏️
Ice Axe Precision ⛏️ represents the absolute necessity of separating distinct layers of information with unforgiving boundaries. Snowblind White provides a vast, uncompromised canvas for the dataset, immediately establishing a feeling of wide-open space. Against this freezing backdrop, Midnight Frost and Graphite Rock construct an impenetrable typographic hierarchy, turning headers and index columns into solid, immovable anchors. Slate Moraine acts as the perfect subtle divider for thin borders and inactive tabs, offering structure without demanding attention. Glacier Melt steps in as the primary interaction color, slicing through the monochrome grid to highlight active selections with biting sharpness. When a critical warning or flagged metric requires immediate intervention, High Altitude Orange flashes with unavoidable intensity. This layout transforms endless columns of numbers into a brutally efficient, razor-sharp instrument.
Whiteout Conditions 🌨️
Whiteout Conditions 🌨️ strips away every single distraction, leaving only the raw, exposed data. Blinding Snow and Void Black create a severe, uncompromising typographic contrast that ensures maximum legibility, even when scanning thousands of lines of text at rapid speed. There is no room for decorative gradients or playful shadows here; everything is reduced to its most functional state. Slate Sky introduces the solitary splash of color, a cold, calculated blue-grey that serves to highlight selected rows or primary navigation paths with clinical precision. Storm Grey handles all the structural heavy lifting, drawing the gridlines, cell borders, and disabled buttons with quiet authority. This extremely restrained color story mimics the sensory deprivation of a high-altitude blizzard, where only the most vital navigation markers remain visible. It forces the user to focus entirely on the task, eliminating decision fatigue and visual clutter.
Alpine Ascent 🧭
Alpine Ascent 🧭 introduces an earthy, tactical dimension to the high-altitude aesthetic, borrowing the tones of rugged climbing gear and exposed rock faces. Alpenglow White acts as a stark, breathable background, ensuring that long-form data remains crisp and easy to scan. Abyssal Black locks down the typographic elements, defining headers and key figures with uncompromising weight. Mariana Slate anchors the active states, delivering a deep, freezing blue that draws the eye toward selected tabs and primary actions. Thin Air Blue and Lichen Green act as functional split-complementary accents, separating positive and negative data trends with cold, calculated efficiency, moving away from traditional traffic-light colors. Muddy Boot grounds the peripheral UI, framing the spreadsheet in a rugged, utilitarian border. The whole composition feels like looking at a meticulously maintained topographical map, prioritizing navigational clarity above all else.
Trading the standard, blindingly bright spreadsheet interface for a severe, mountain-inspired aesthetic fundamentally changes the way we process large volumes of information. By treating the workspace as an extreme environment, we strip away the trivial and prioritize what actually matters. The freezing blues and unrelenting greys force a mental reset, providing the exact visual relief required to maintain operational precision over long hours. This approach proves that utilitarian design does not need to be uninspired; it can be incredibly sharp, highly tactical, and profoundly effective at cutting through the noise.